How to Debug Using Whistle Tool?
📝 One-Click Installation
Refer to this Whistle Installation Tutorial
🖖 How to Debug Mobile Scenarios
After preparing the environment, follow these steps:
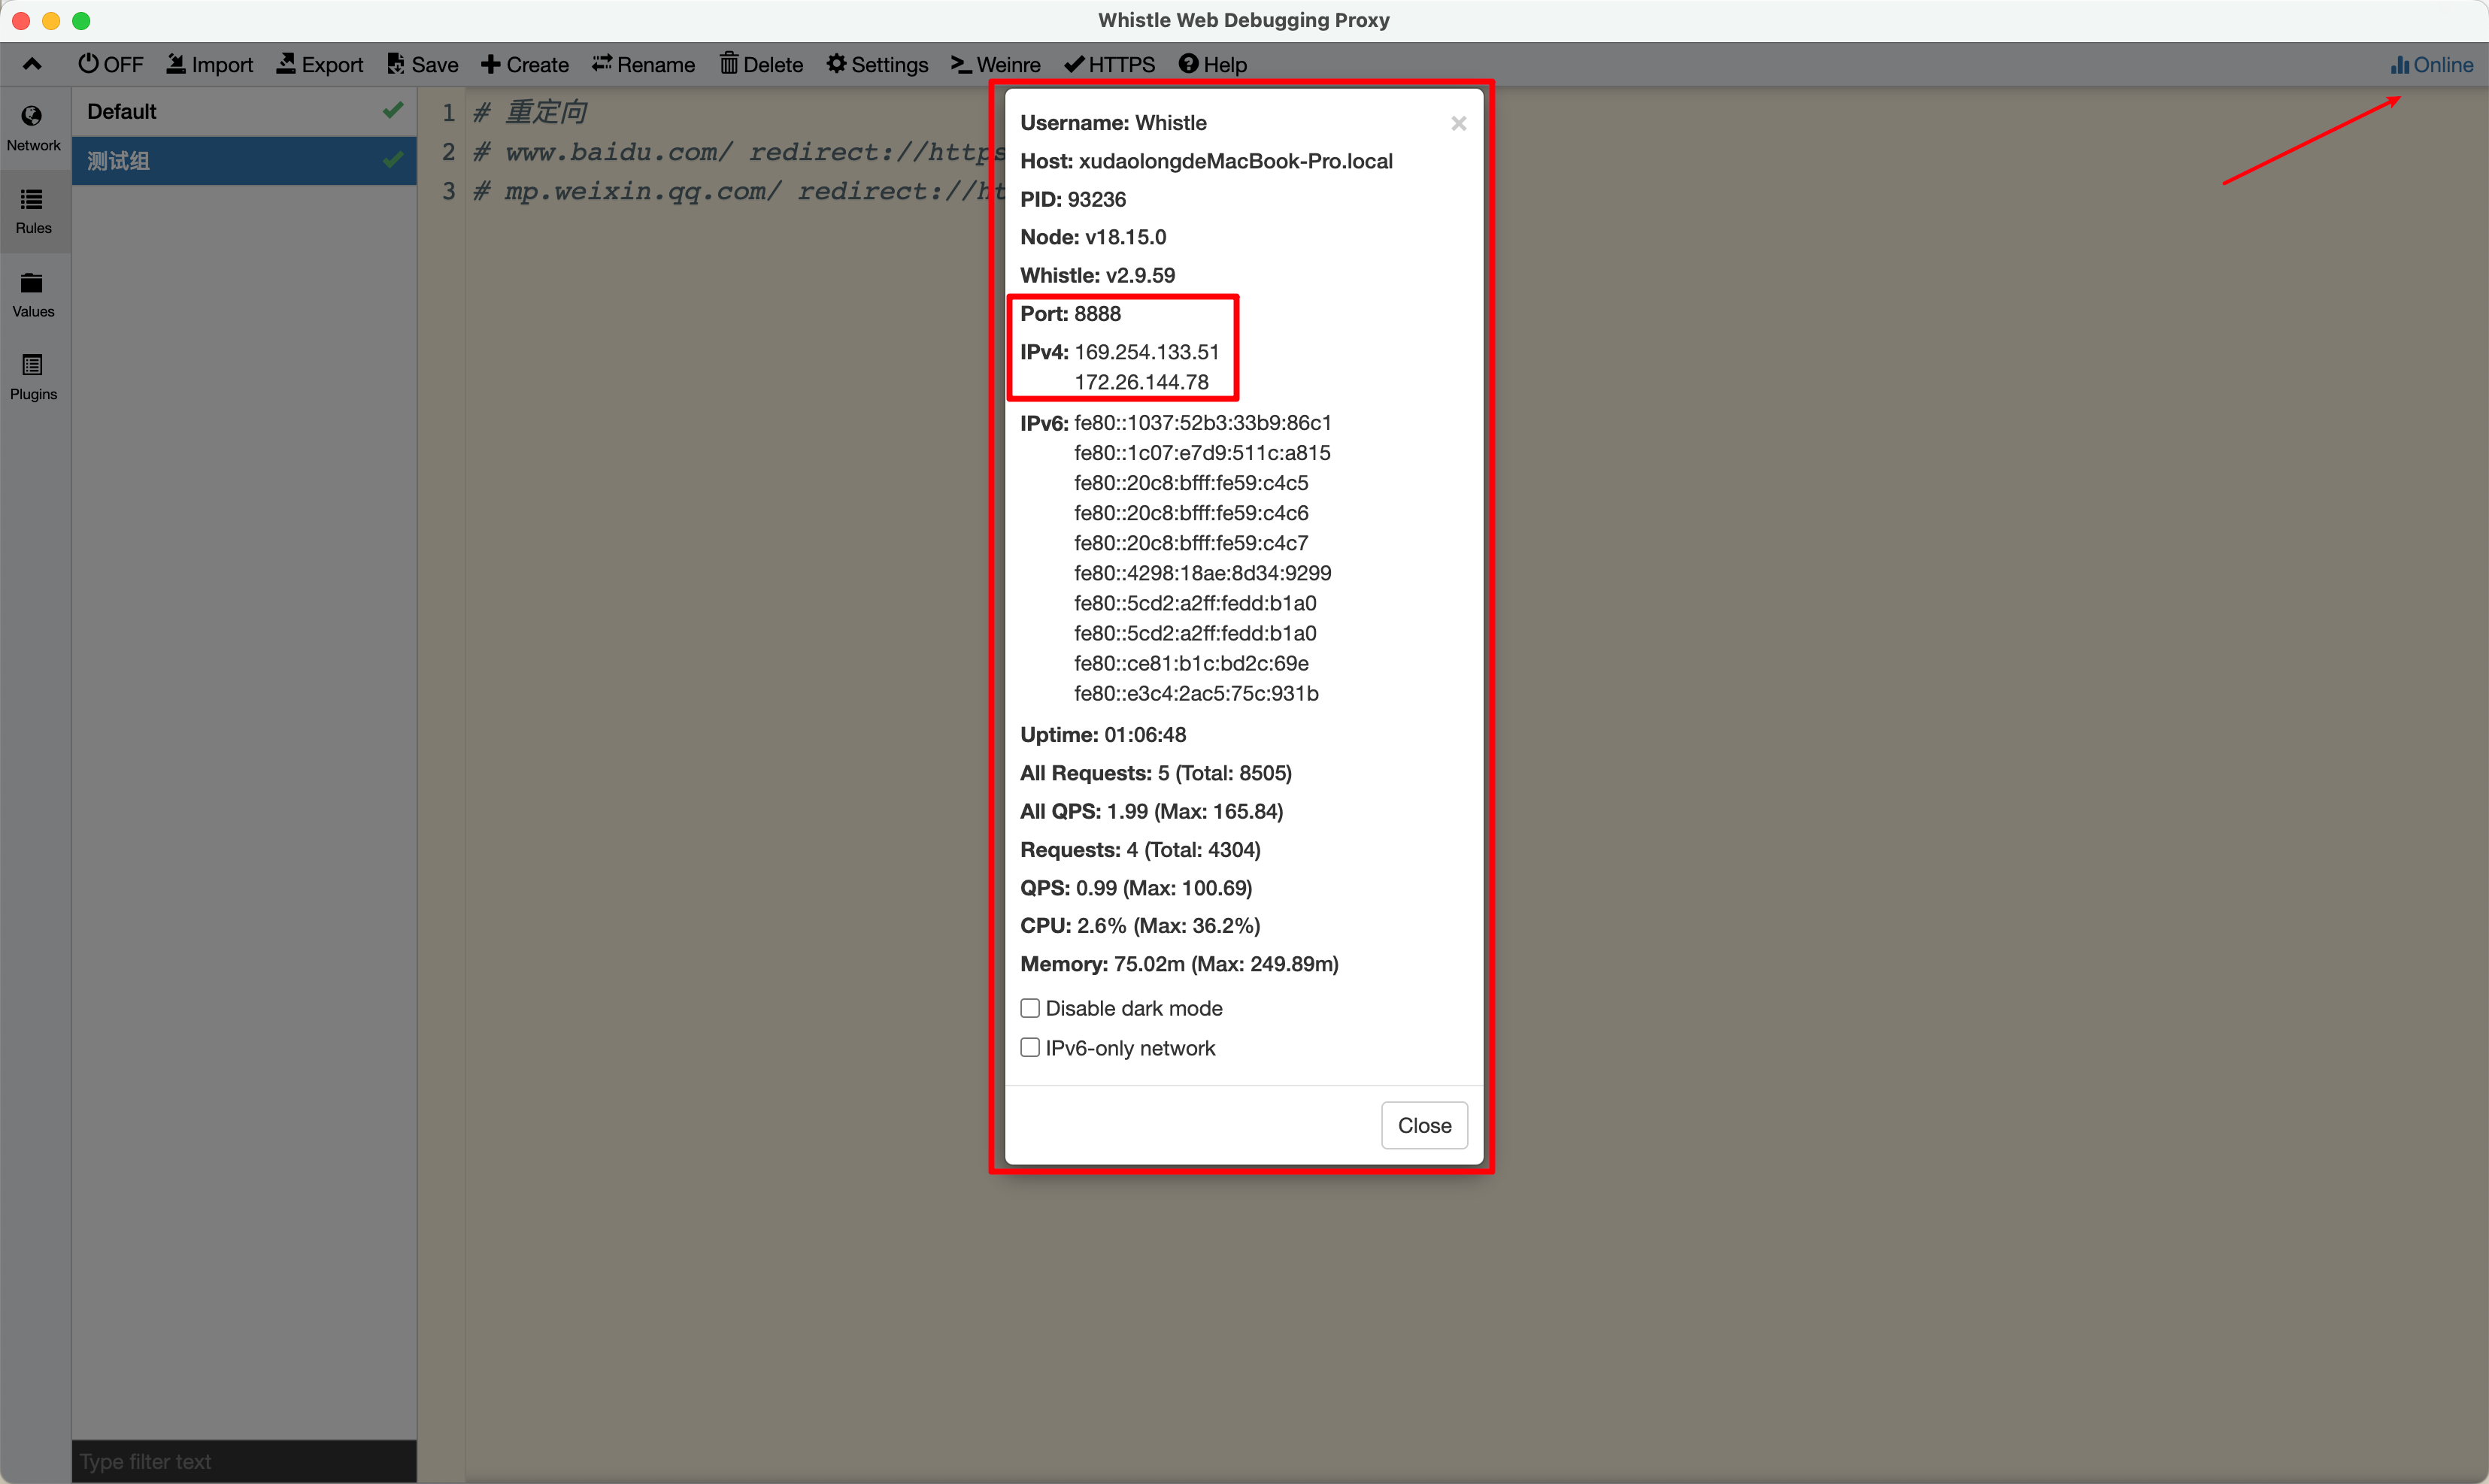
Step 1: Configure Network Proxy
-
Ensure you’re on the same local network, i.e., connect to the same WiFi.
-
Configure WiFi proxy settings, get proxy information from below, associate Server & Port.
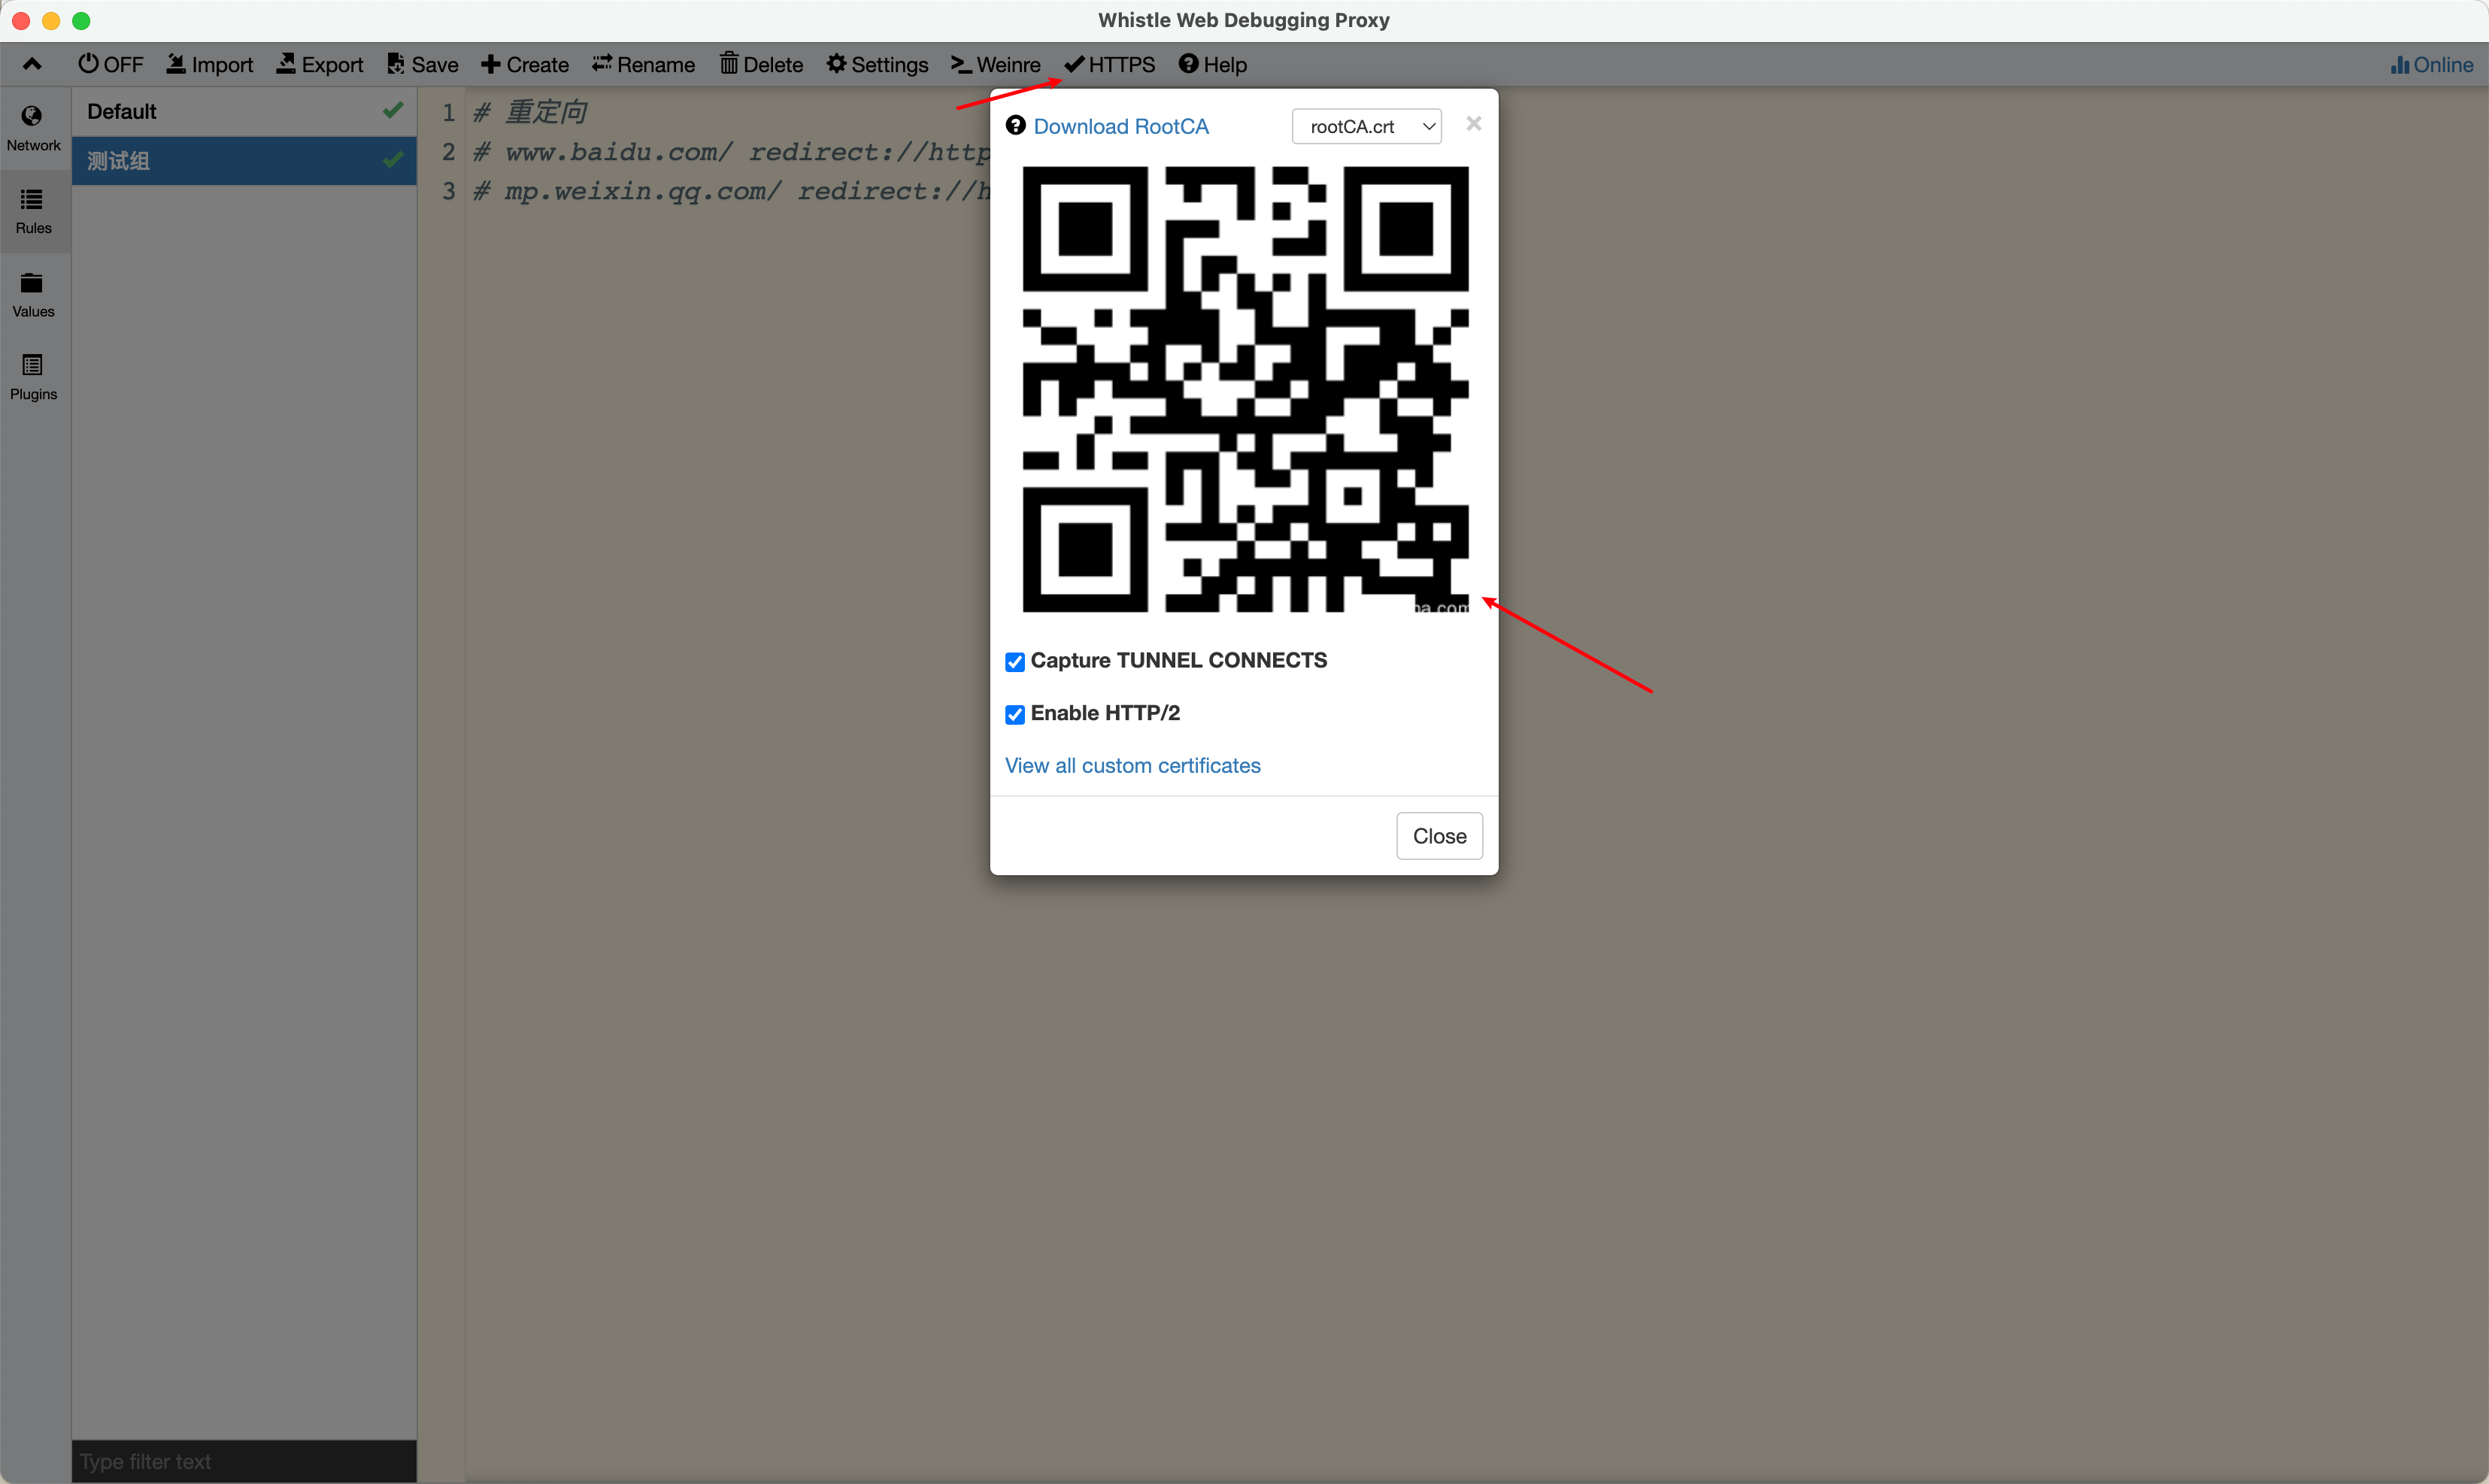
Step 2: Install Certificate
Install the certificate correctly, click “HTTPS” to scan QR code or open browser and visit the address above “IP:Port”.
Android: CA certificate installation entry, search for “certificate”
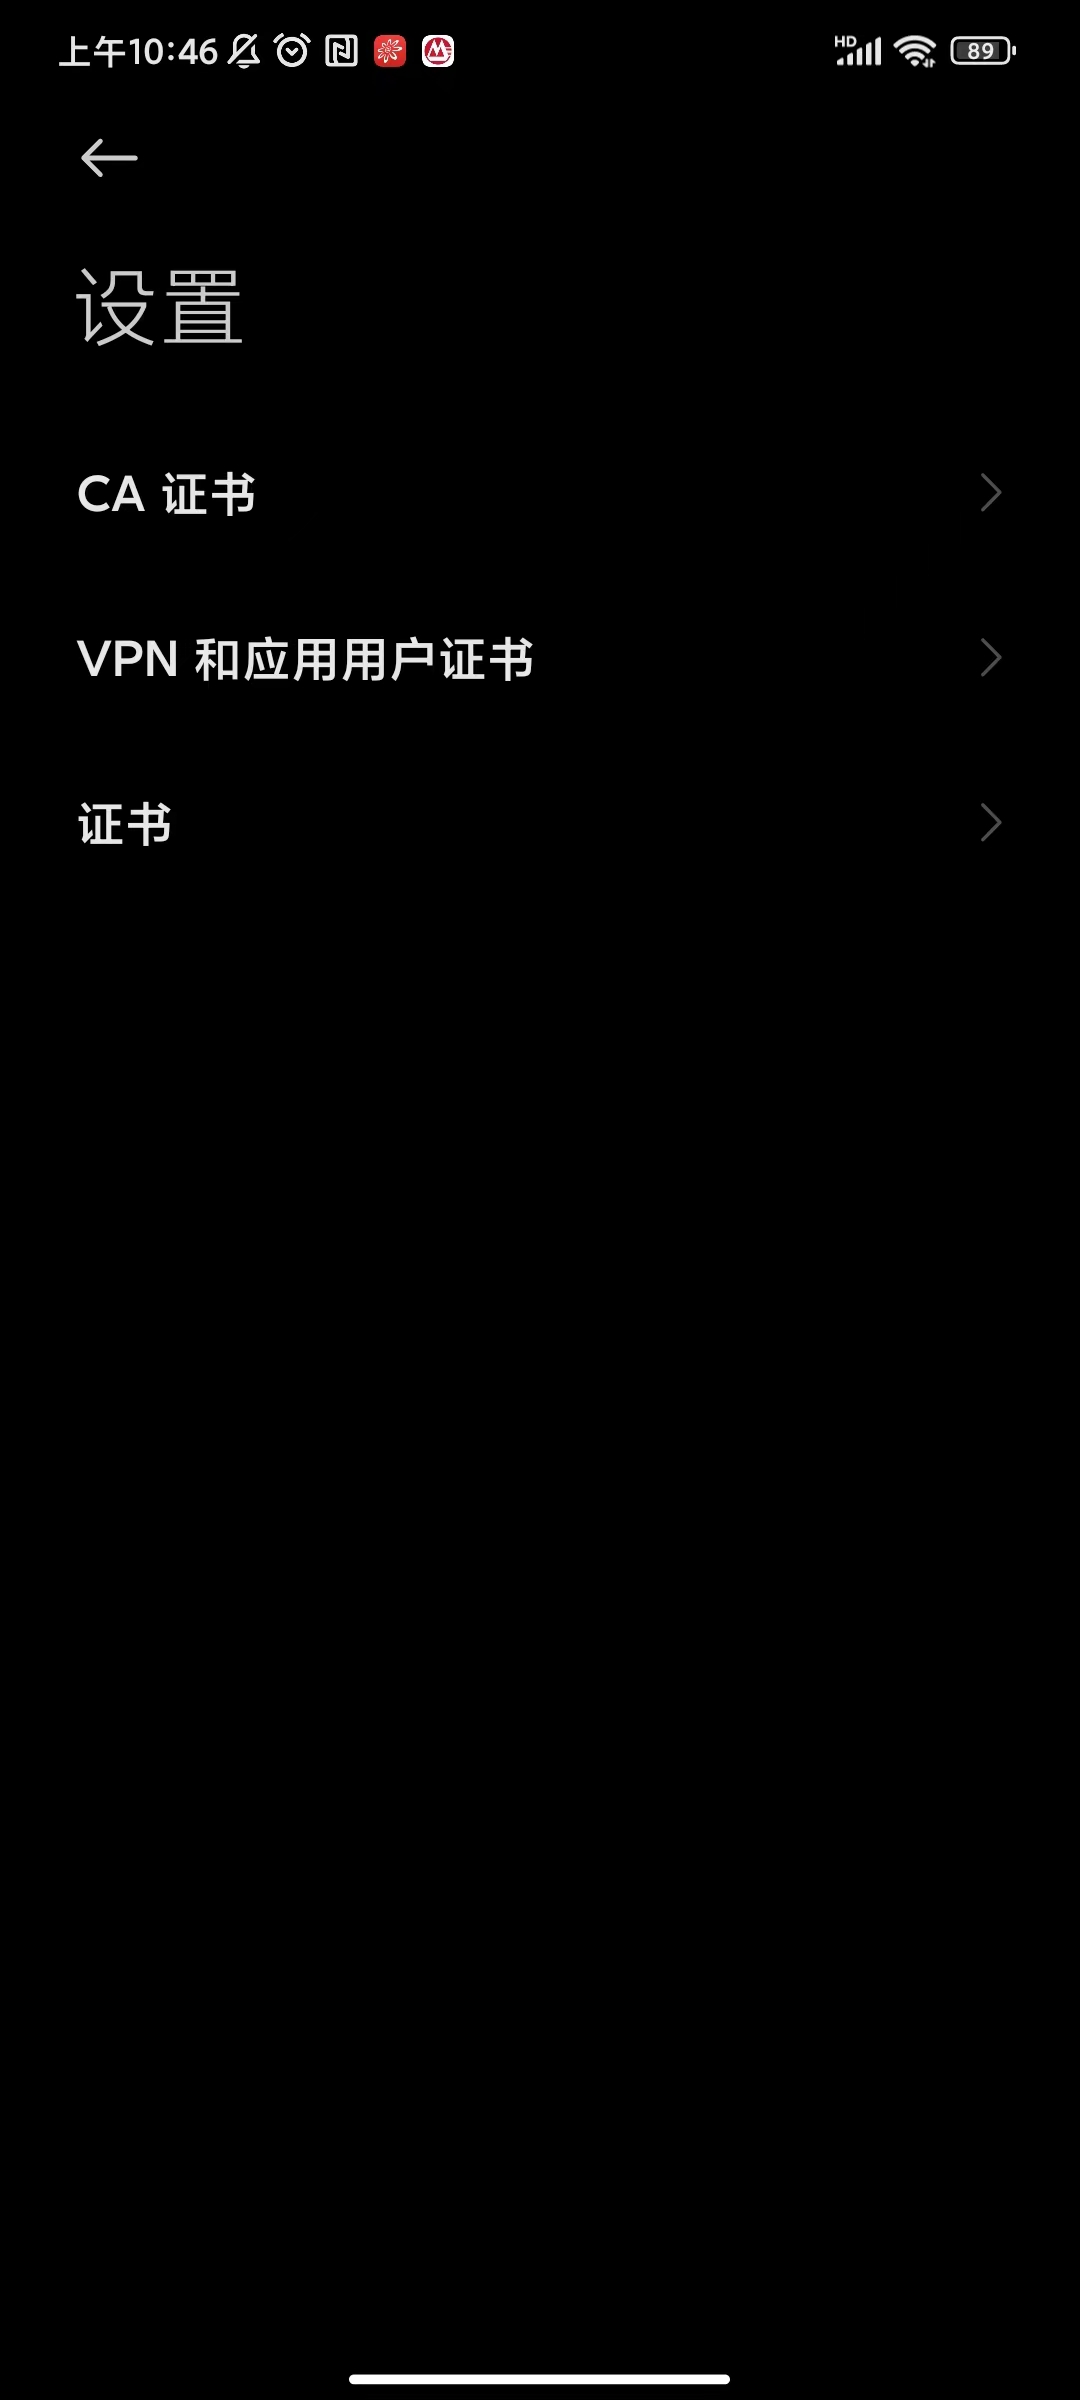
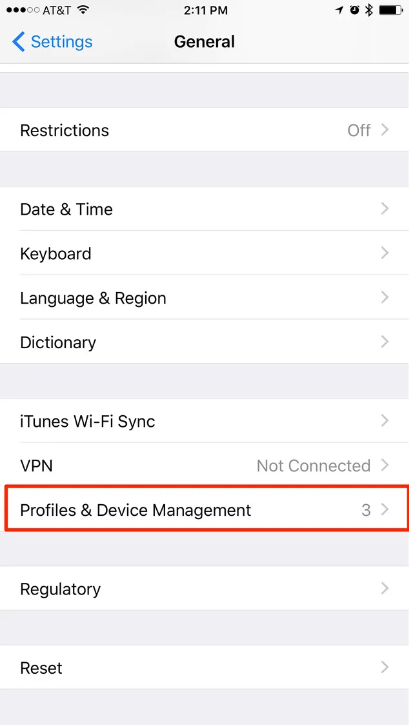
iOS: Certificate installation entry, “Profiles & Device Management”
How to Associate Proxy for Debugging Apps?
Below uses debugging TikTok App’s Webview interface as an example
Default configuration:
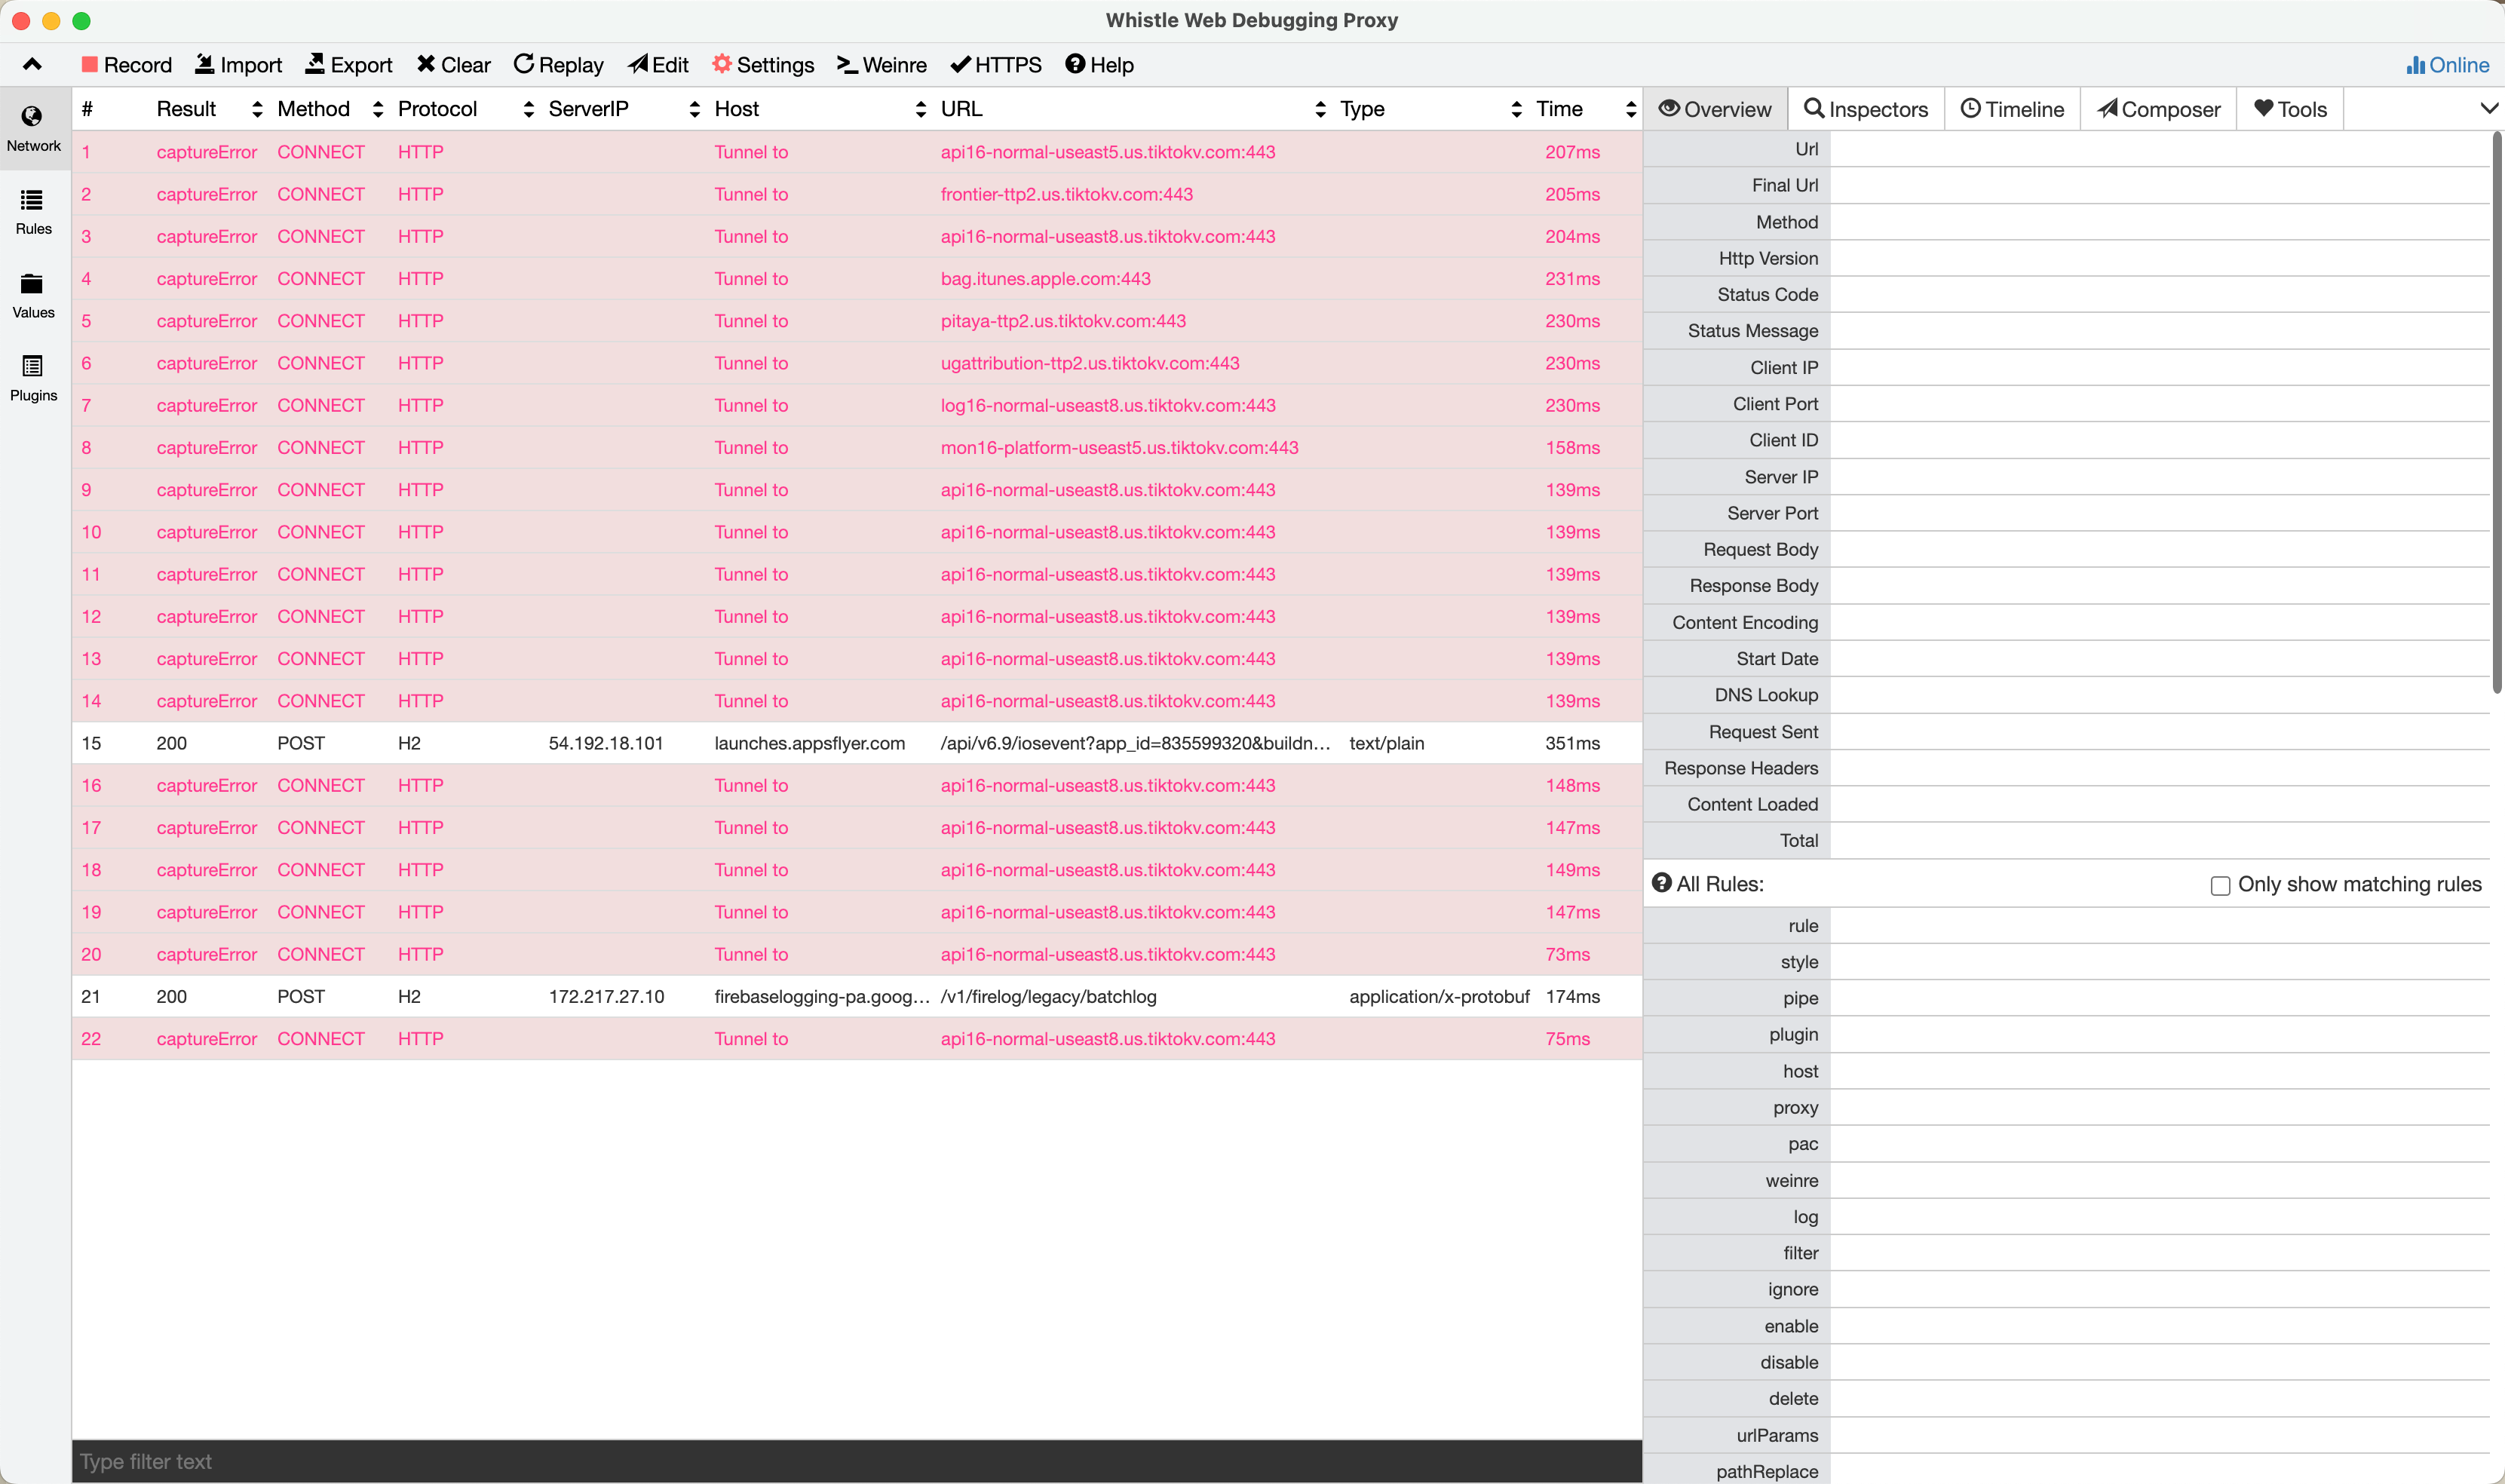
Add Rules group:
# All traffic goes through local proxy, requires VPN here
* socks://127.0.0.1:4781
# Configuration for TikTok
disable://capture *.tiktok.com *.tiktokv.com *.byteoversea.com *.apple.com *.tiktokv.us *.us.tiktokv.com
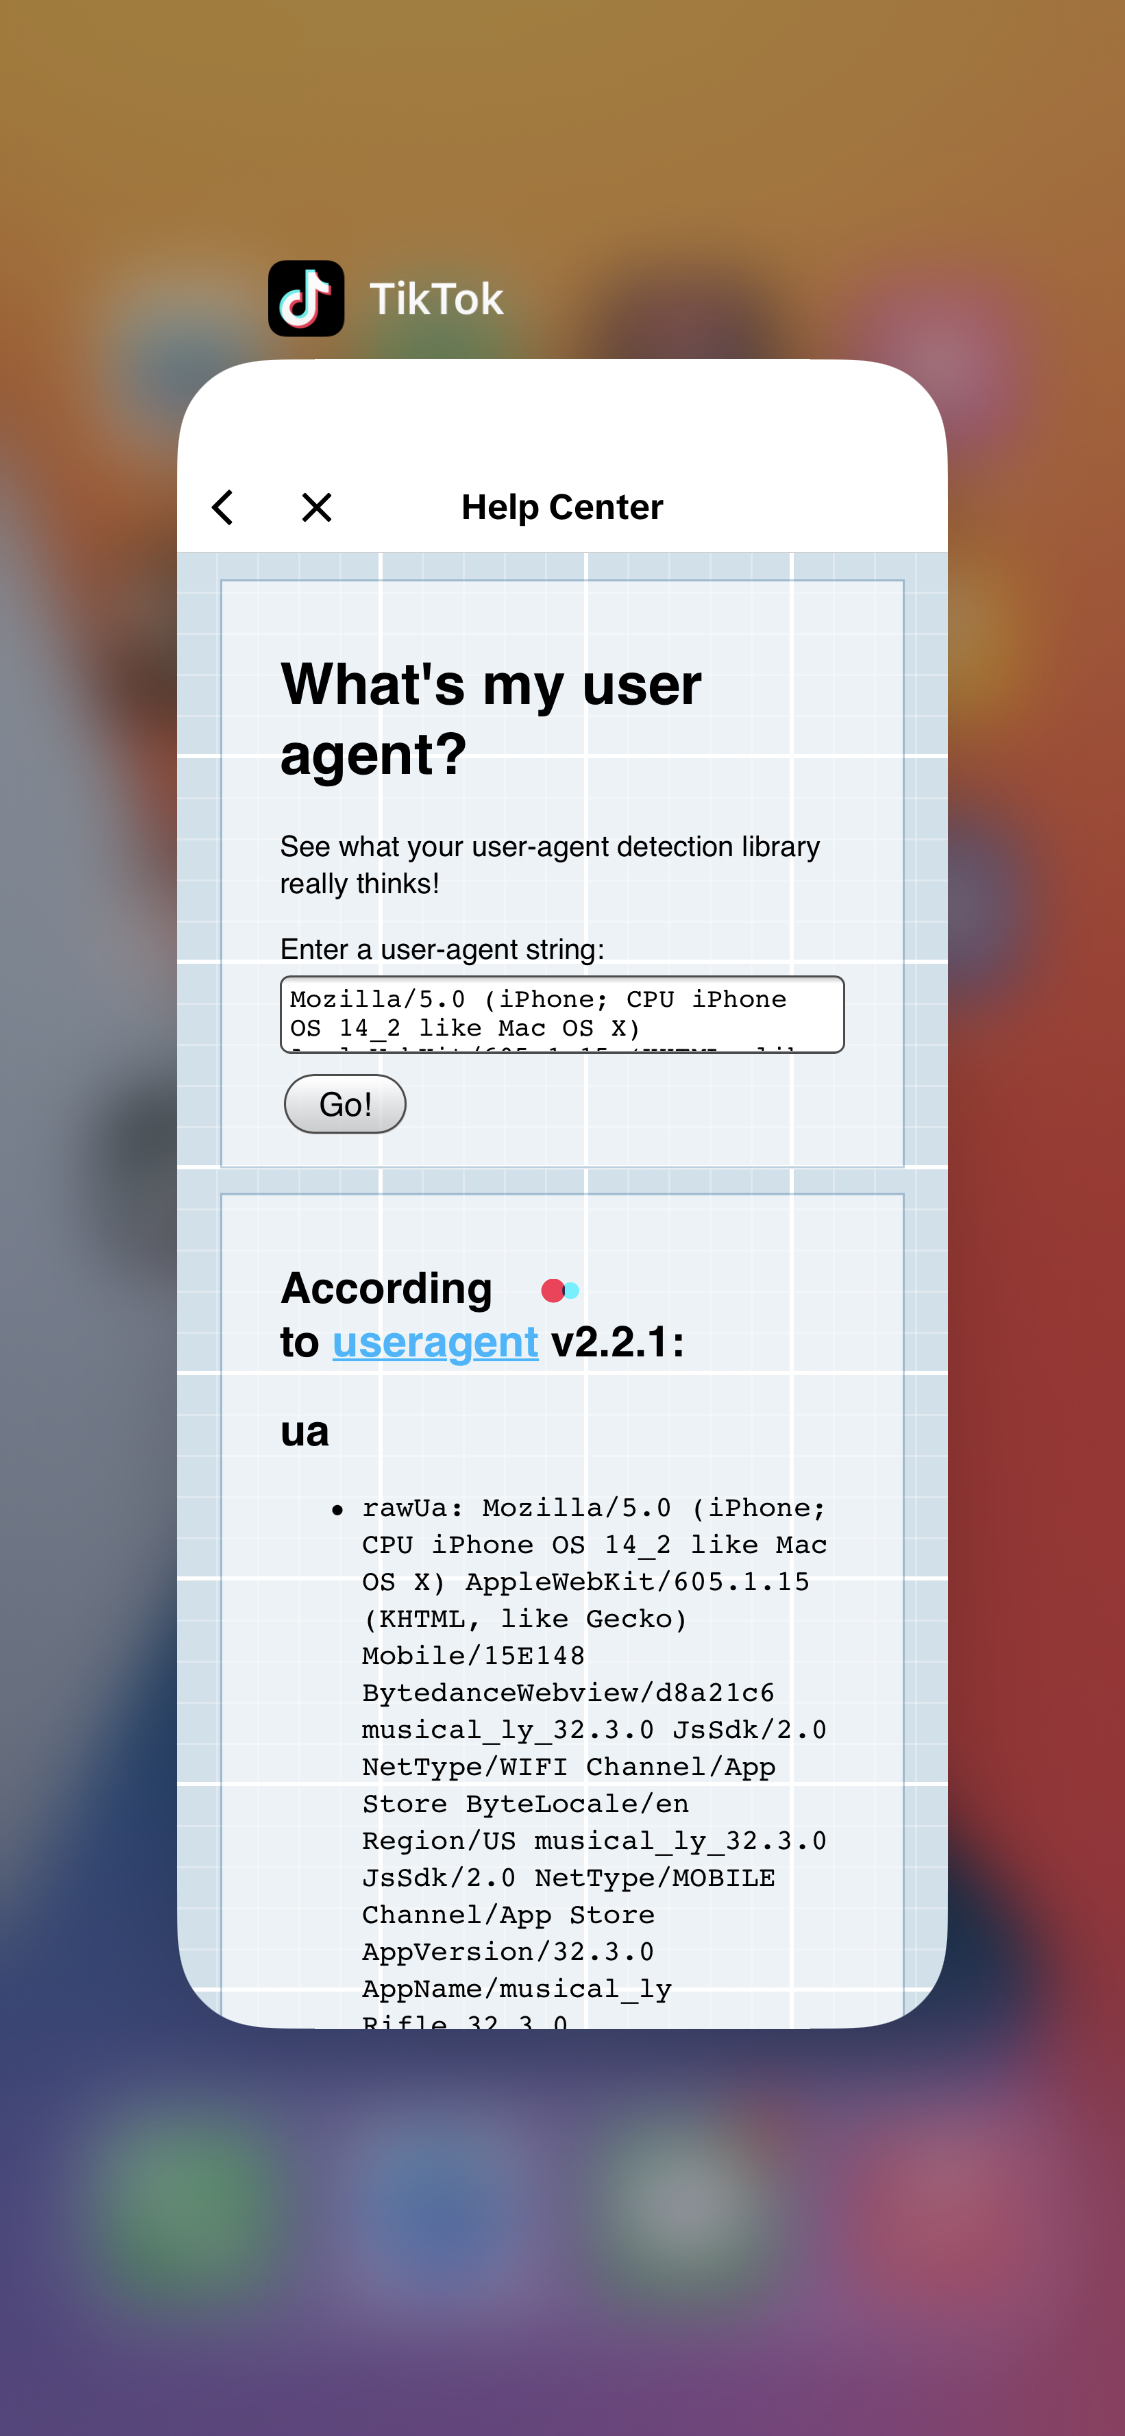
# Find a Webview entry, check current Webview's Useragent, examples: "Settings and Privacy" / "Support" / "Help Center"
support.tiktok.com/ redirect://https://www.whatsmyua.info
# Redirect to execute business scenario
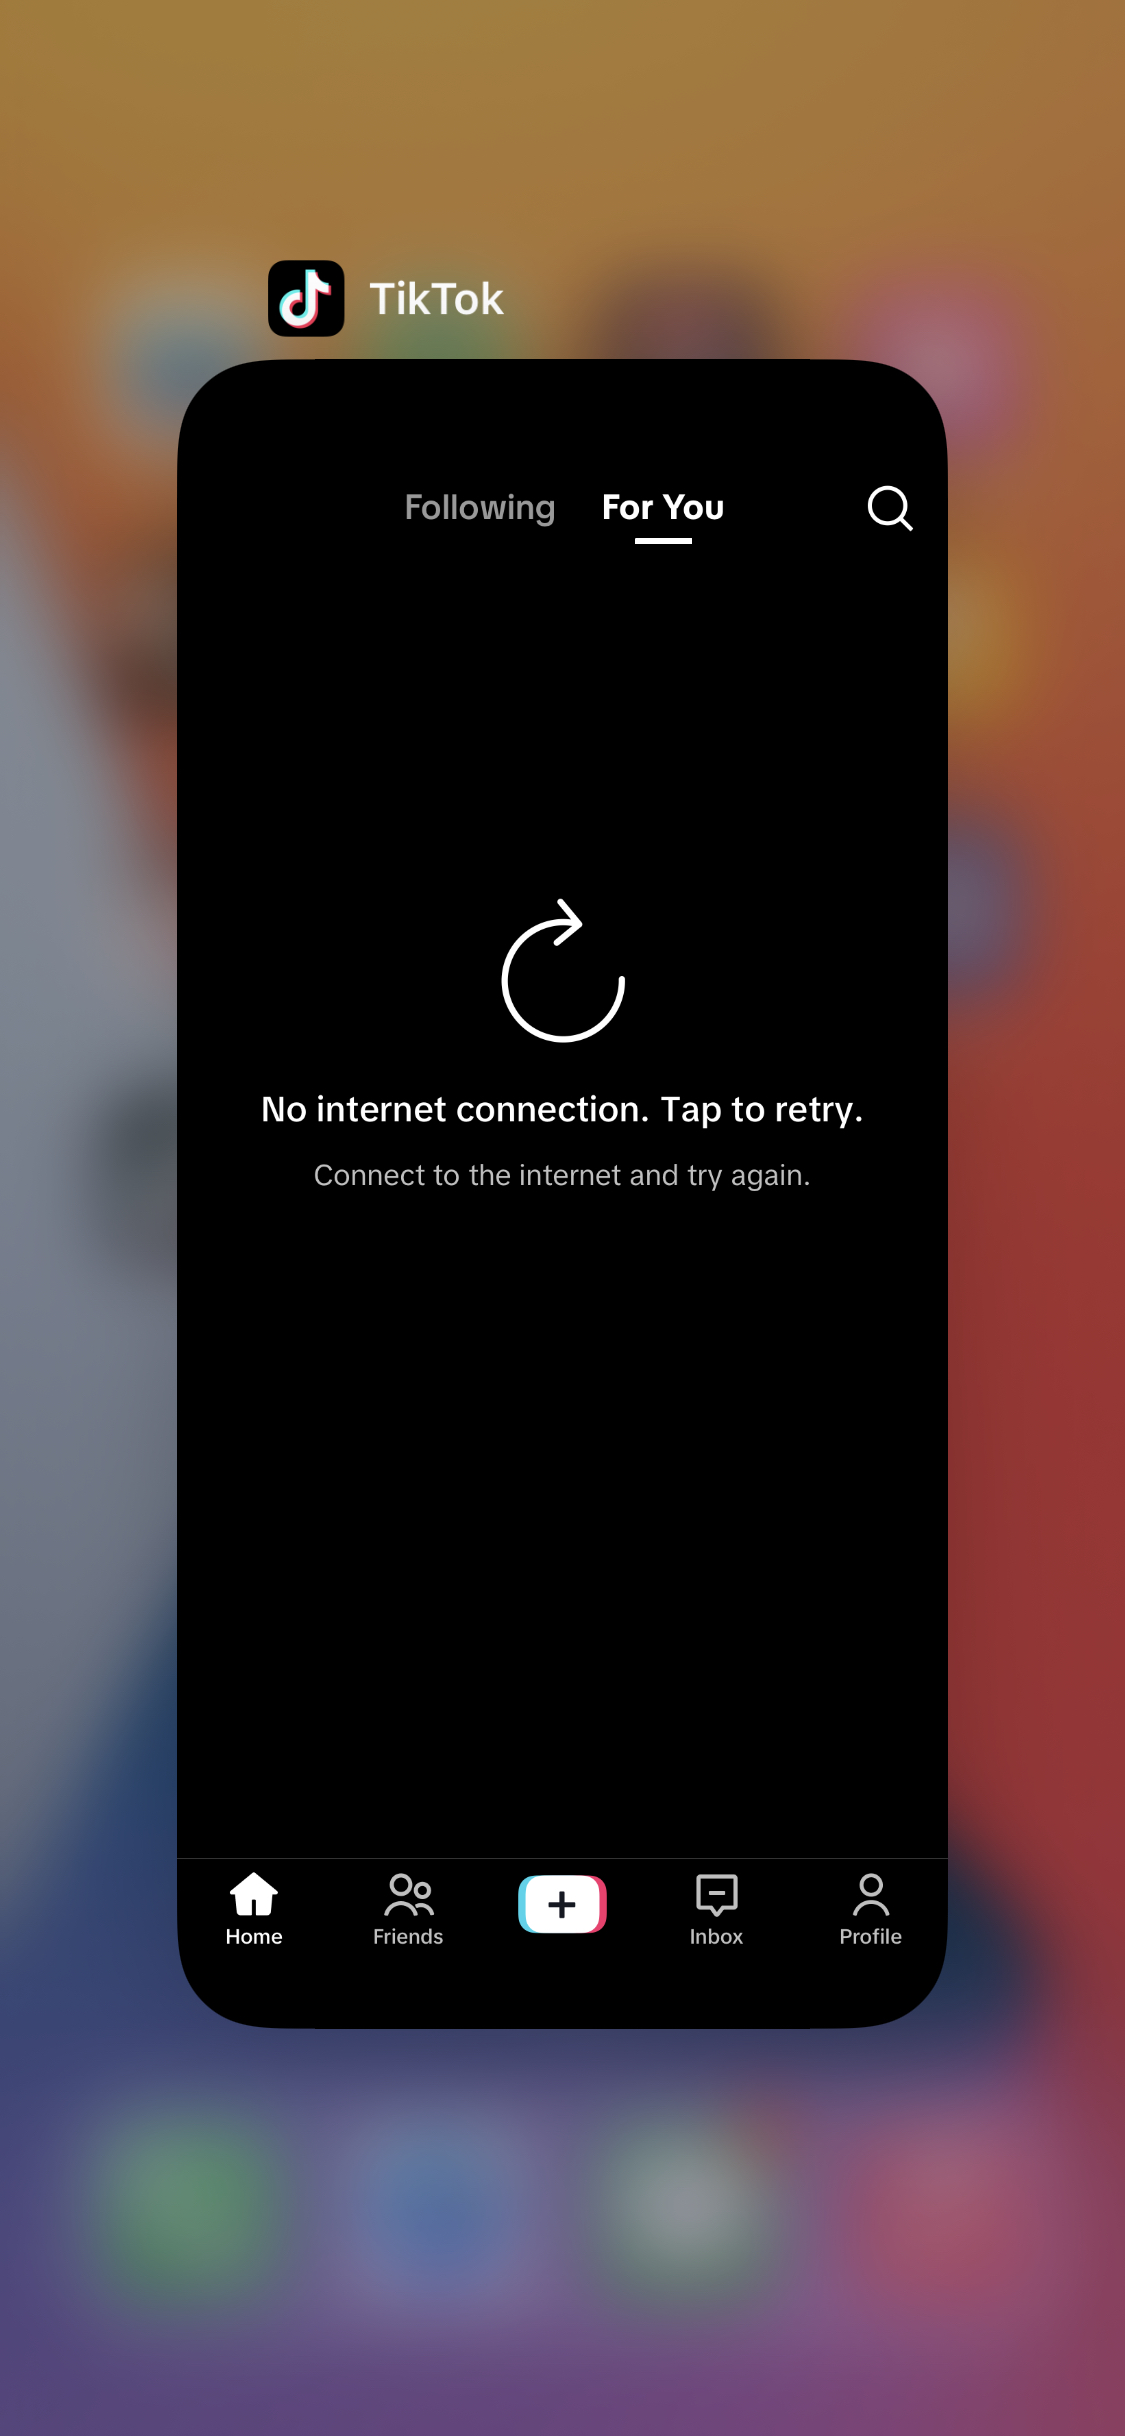
# support.tiktok.com/ redirect://https://www.xxx.com/xxxContent displayed before proxy:
Successfully proxied and redirected page:
How to Integrate Plugins for H5 Page Debugging Tools like vConsole, eruda, mdebug?
Install Plugin
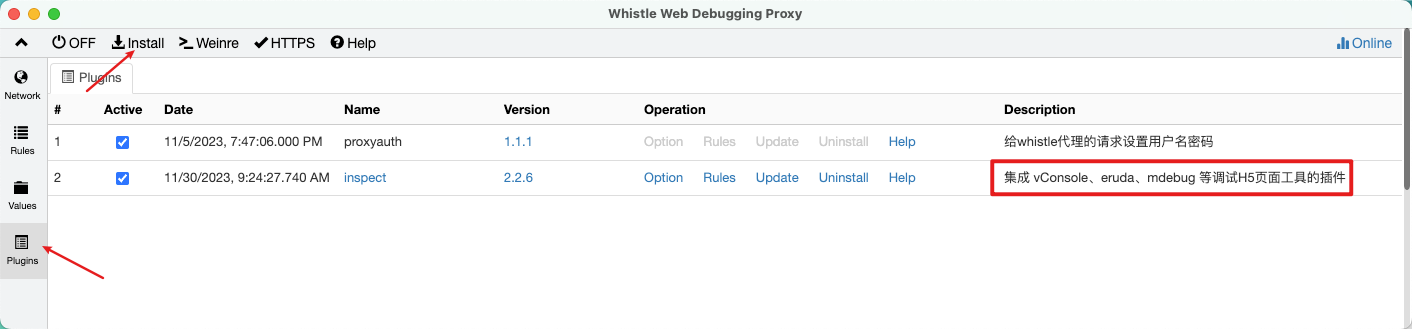
npm i -g whistle.inspectConfigure Plugin
www.baidu.com/ whistle.inspect://eruda
www.baidu.com/ whistle.inspect://vconsole
www.baidu.com/ whistle.inspect://mdebug